
Introduction to EKG 12-Lead Interpretation
Electrocardiography, commonly known as EKG or ECG, is a fundamental tool in the realm of cardiology. The 12-lead EKG, in particular, provides a comprehensive view of the heart's electrical activity from 12 different angles, offering a panoramic understanding of its rhythms and potential abnormalities. This guide aims to take you on a methodical journey through the intricate world of 12-lead EKG interpretation. We'll explore the heart's electrical landscape, delve into the significance of various waveform components, and provide a roadmap to diagnose common as well as intricate cardiac conditions. With heart-related ailments being a leading cause of global morbidity and mortality, the accuracy in EKG interpretation is not just an academic exercise—it's a life-saving skill. By mastering the nuances of the 12-lead EKG, healthcare professionals can make timely, informed decisions that profoundly impact patient outcomes. Whether you're a novice seeking foundational knowledge or a seasoned practitioner looking for a refresher, this guide is designed to sharpen your interpretative prowess.

The Basics of Cardiac Physiology
At the heart of EKG interpretation lies an understanding of the cardiac electrical conduction system—a marvel of nature that keeps our hearts beating in synchronized harmony. This system initiates and conducts electrical impulses, ensuring that the heart contracts in a specific and organized manner. Beginning at the sinoatrial (SA) node, often dubbed the heart's natural pacemaker, an electrical impulse is generated and travels through the atria, causing them to contract. This impulse then converges at the atrioventricular (AV) node, from where it descends through the Bundle of His, branches into the right and left bundle branches, and finally permeates the ventricles via the Purkinje fibers, leading to a coordinated ventricular contraction. On an EKG strip, this orchestrated cascade of events translates into waves and complexes. The initial atrial depolarization is seen as the P wave, while the subsequent ventricular depolarization is reflected in the QRS complex. Following that, the T wave showcases ventricular repolarization. The EKG, in essence, is a graphical representation of this physiological symphony, capturing the heart's electrical dance in real-time. By understanding this underlying system, one can correlate the nuances on an EKG strip with the heart's anatomical and functional events.
Components of an EKG Waveform
Deciphering an EKG requires a keen understanding of its fundamental components, each of which tells a distinct story about the heart's electrical activity. To start, the P wave represents atrial depolarization, providing insights into the initiation and spread of the electrical impulse through the atria. A regular, upright P wave typically suggests a rhythm that's originating from the sinoatrial node. Following the P wave, a short pause—depicted by the PR interval—allows the impulse to pass from the atria to the ventricles via the atrioventricular node.
Next in line is the QRS complex, a crucial component that represents ventricular depolarization. Consisting of the Q, R, and S waves, this complex can vary in shape and duration, with deviations often pointing towards conditions like bundle branch blocks or ventricular hypertrophy. Notably, the QRS complex also masks the atrial repolarization, which isn't visible on a standard EKG.
Lastly, the T wave mirrors the ventricular repolarization, the phase where the ventricles reset electrically in preparation for the next heartbeat. Its shape and direction can be influenced by a myriad of factors, including electrolyte imbalances, medications, and ischemia.
Apart from these primary elements, there are other vital segments and intervals on the EKG, such as the ST segment and the QT interval, which offer added layers of diagnostic information. Collectively, these components create a rhythmic pattern on the EKG, and understanding each of their roles is pivotal for accurate and insightful interpretation.
Lead Placement and Orientation
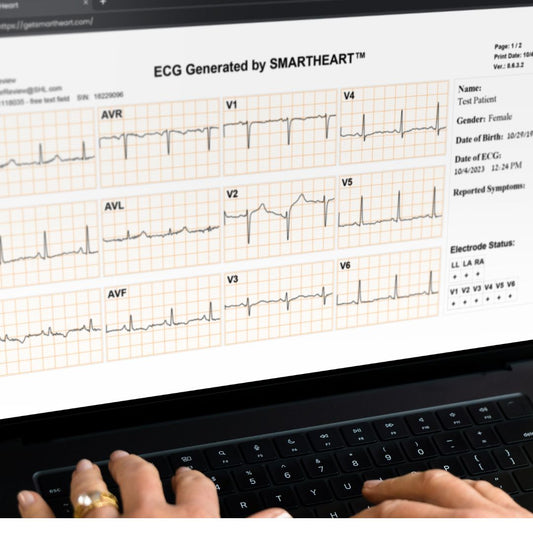
The term "12-lead EKG" can initially seem daunting to the uninitiated, but it essentially refers to the 12 different viewpoints (or leads) from which the heart's electrical activity is observed. Each lead offers a unique vantage point, capturing the heart's electrical symphony from varied angles. Proper placement is paramount to ensure accurate readings.
The 12 leads are divided into two main categories: limb leads and chest (precordial) leads. The limb leads consist of I, II, III, aVR, aVL, and aVF. These leads are attached to the patient's limbs. Leads I, II, and III are termed bipolar leads, providing a frontal plane view of the heart, while aVR, aVL, and aVF are unipolar, focusing on specific regions of the heart's front and bottom.
On the other hand, the chest leads (V1 to V6) are placed in specific locations across the chest, capturing the heart's electrical activity in the horizontal plane. Starting from V1 near the right edge of the sternum to V6 located horizontally in line with V4 at the left mid-axillary line, they offer invaluable insights into the heart's anterior, lateral, and septal regions.
In essence, these 12 leads collectively provide a 360-degree perspective of the heart. They allow for pinpointing areas of injury, ischemia, or infarction, and their accurate placement is foundational to capturing a comprehensive and diagnostic EKG.
Conclusion
The intricate dance of electrical currents within our heart, vital for sustaining life, is brilliantly captured in the traces of a 12-lead EKG. It's a tool that, while based on complex physiological processes, can be demystified with understanding and practice. From recognizing the foundational aspects of cardiac physiology to discerning the minute details in waveform components and the crucial significance of lead placements, we've journeyed through the essential steps to interpret the stories that our hearts tell. With heart ailments continuing to be a pressing concern globally, mastering the art and science of EKG interpretation is not just a professional milestone but a testament to our commitment to ensuring optimal patient care. Whether you're starting your EKG journey or revisiting the basics, remember that each line, wave, and interval you interpret holds the potential to change, and perhaps save, a life. Armed with knowledge and a dedication to precision, we can harness the power of the 12-lead EKG to its fullest potential.